Carbon Dioxide Trends Since 1958
The Mauna Loa Observatory in Hawaii has been recording atmospheric CO₂ levels since 1958. The dataset offers great insights into the state of the earth in the past, present, and where it could be in the future.

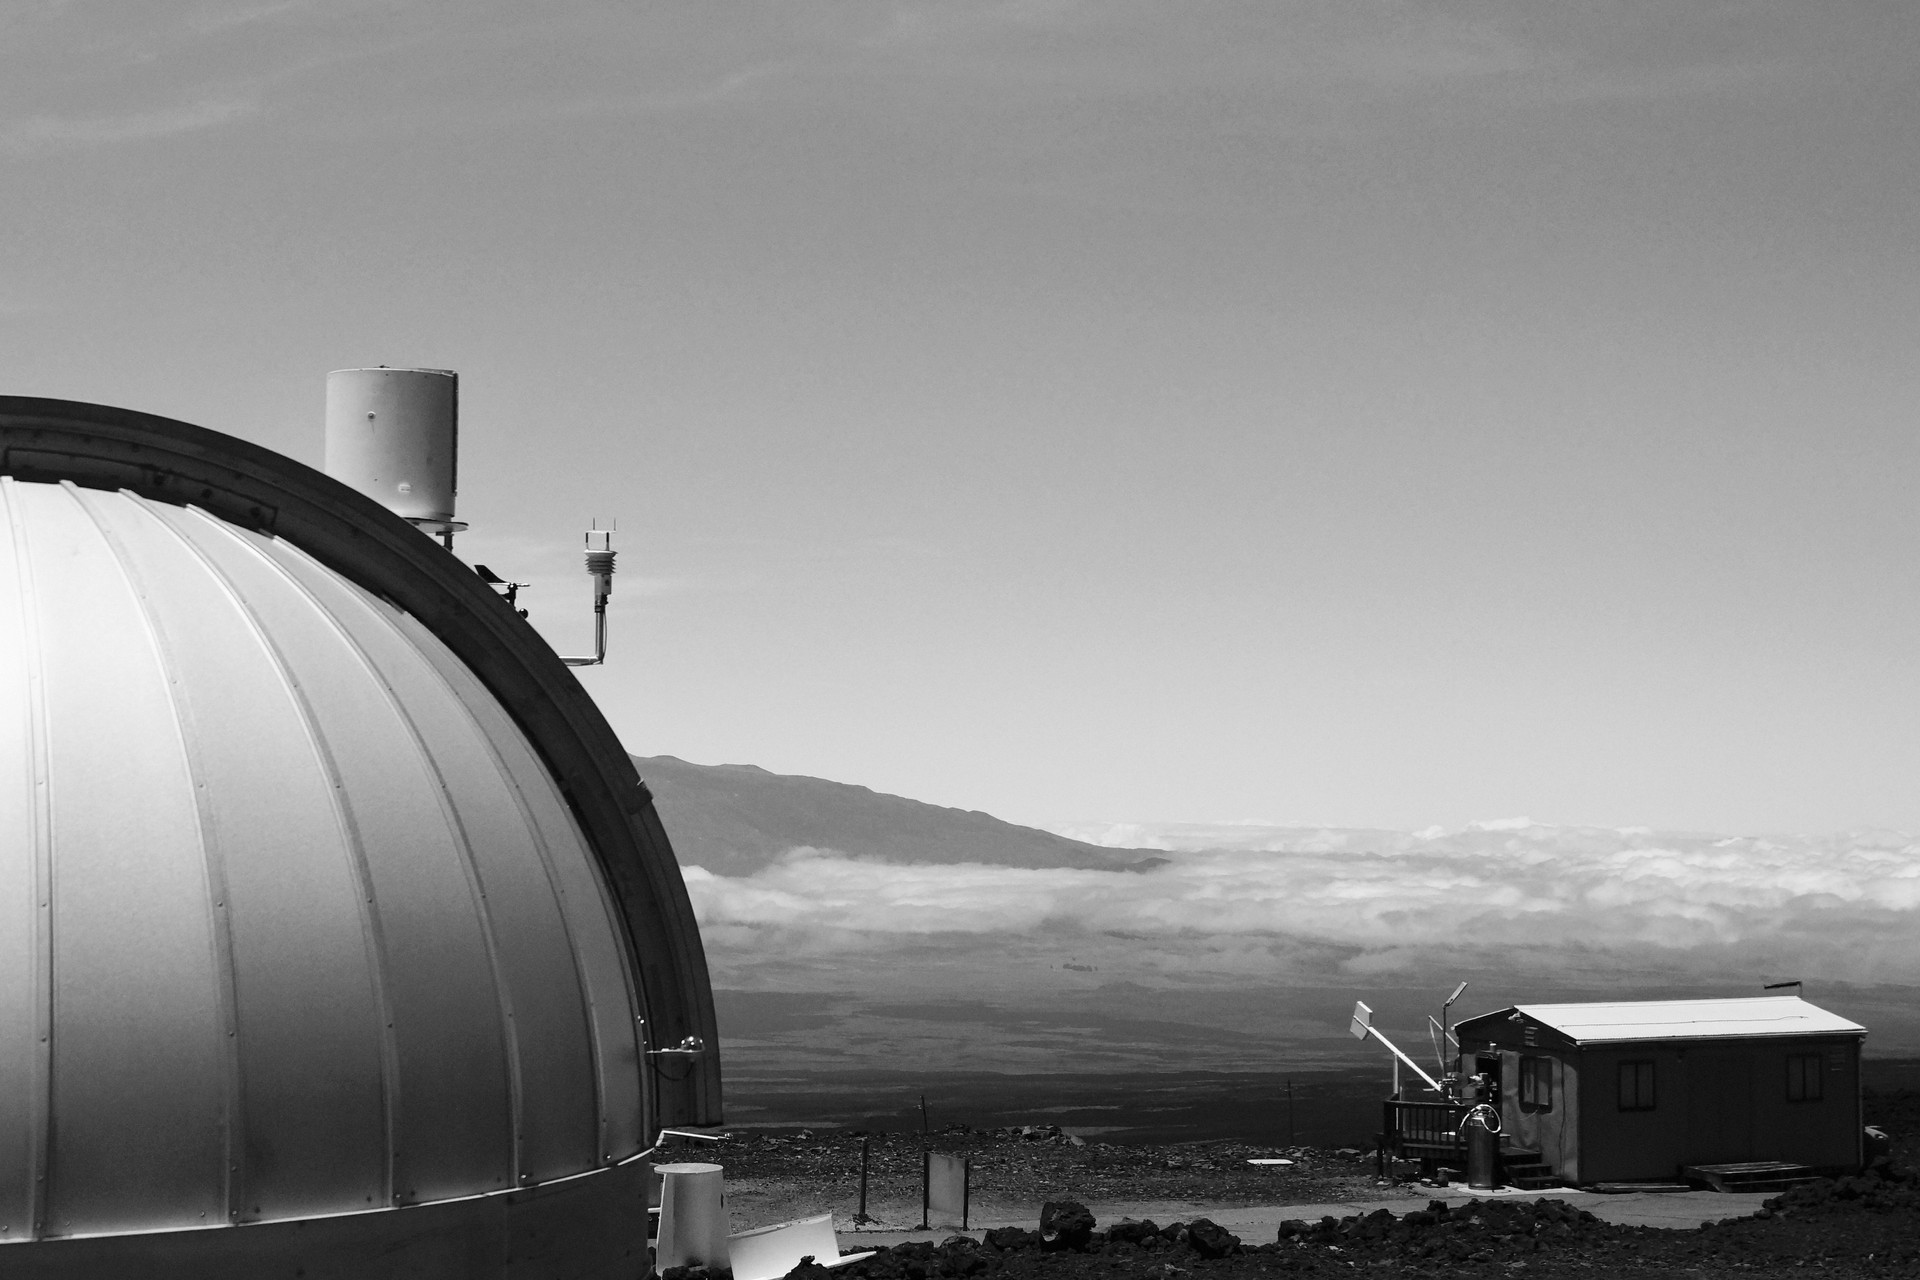
On the northern flank of Mauna Loa volcano in Hawaii, at 11,000 feet above sea level, sits the Mauna Loa Baseline Observatory, which has been recording atmospheric carbon dioxide levels since 1958.
The high altitude and remote location means that the air around the observatory is relatively undisturbed. There is little vegetation and human activity to influence the air’s composition, making it ideal to measure atmospheric constituents there.
The National Oceanic and Atmospheric Administration (NOAA), which operates the observatory, provides such measurements as publicly accessible datasets. Its carbon dioxide data in particular paints a worrying picture of the rise in greenhouse gases in recent decades.
Another way to look at data with cyclic, seasonal patterns is with polar plots, a type of visualization that presents data on a polar coordinate system.
When the full, 360-degree range of the plot matches the length of the cycle (in this case 1 year), we get a data line whose shape reveals seasonal variations and whose the outward/inward movement better demonstrates the yearly increase/decrease with less seasonal noise.